Generative Terrain
Prerequisites
This mini-project draws on materials from:
Multi-Dimensional Noise
Towards the end of the noise exercises, we saw how to call the noise() function with multiple parameters to get a sequence of values that varies consistently in multiple dimensions.
This means that when we call noise(x, y), as long as the sequences that we use for x and y both vary gradually, the resulting sequence will also vary gradually and each value will still be somewhat related to the previous one.
Let’s visualize this.
Let’s first iterate through our canvas and pick a random grayscale value to draw at every pixel:
Pretty random. Each pixel value is completely independent of its location and of previous values.
Let’s use noise(x) now, and remember that we might want to divide the value of x by \(10\) or \(100\) in order to only gradually change the value returned by noise() slightly as we move from location x to x + 1:
We get stripes, since every row of pixels calls noise(x) with the exact same values for x. We saw this before when we looked at a grid of ellipses.
Let’s use noise(x, y), so we can vary our parameters to noise() by row and column:
Now, every pixel’s color is slightly related to the colors around it, which makes the canvas look like smoke or clouds.
Noisy Colors
Let’s experiment with colors, and use noise(x, y) to pick how much we vary between two complementary colors.
We’ll use the noise() function to pick a value between \(0\) and \(255\) for the red channel of our color, we’ll keep the green channel always a constant, and the blue channel will always be the inverse of the red channel:
This is cool, but it still looks like clouds. Let’s add some thresholding to try to bring out more of the yellows. We’ll do this by using an if() statement and forcing the color to full yellow even when it’s just barely above the halfway point between yellow and blue:
This looks pretty cool, let’s do something similar to the blue. Let’s force it to full blue even if the amount of yellow is just below the halfway point:
This is starting to look like a map! And every time we run the sketch we get a different pattern!
2D Terrains
We can already see how something like this can be used to create \(2D\) maps or terrains in video games.
Let’s reorganize our code a little bit, and adjust our thresholds and colors.
We’ll use a variable called nLevel, to store each pixel’s noise level as a value between \(0\) and \(1\). We’ll then use this value to threshold our noisy canvas and pick from one of $4\(or\)5$$ colors that will make up our map.
We can change the parameters to the noise() function to adjust how our map looks. What’s the effect of calling noise(x / 50, y / 50) or noise(x / 200, y / 200) instead of noise(x / 100, y / 100)?
Change the noiseFactor variable above and see what effect it has on our map ☝️.
3D Terrains
#spoilerAlert: the third dimension is time.
So, just like we added another parameter to the noise() function to make sure pixels that are close to each other end up with similar colors, we can also add a third parameter to allow us to change our map gradually from frame to frame. We’ll call noise(x, y, t), where t is a sequence of values related to the frameCount of our running sketch:
This works, but trying to update all pixels every frame is a bit too much work for the browser, even with a small canvas.
We can take advantage of the fact that we can scale the frameCount by noiseFactor to control how similar/different consecutive frames are, and instead of updating every pixel every frame, we can just iterate over every other pixel.
We’ll use a variable called pixelGroup that will alternate between \(0\) and \(1\) each frames and will let us know which rows of pixels to update at a given frame, the even rows or the odd ones:
This already makes our sketch twice as fast, since we’re only updating half of the pixels every frame.
Can we do better ? What if we implement the same trick for the columns as well as the rows?
🤔
Kind of works, but it looks like we’re only ever updating half of the pixels. The other half stays pink.
What’s happening is that we’re only ever updating pixels that are in even rows AND even columns, or odd rows AND odd columns, but pixels in even rows and odd columns or odd rows and even columns don’t ever get updated.
What we have to do is split the pixels into \(4\) groups, and iterate through every pixel in each of these groups every other \(4^{th}\) frame.
The math for calculating the start pixel at every row and column is a bit strange at first:
let pixelGroup = frameCount % 4;
let xStart = pixelGroup / 2;
let yStart = pixelGroup % 2;
But if we look at the values for xStart and yStart we’ll see that this is one way to get all possible combinations of even/odd row and column numbers:
| pixelGroup | xStart | yStart |
|---|---|---|
| \(0\) | even |
even |
| \(1\) | even |
odd |
| \(2\) | odd |
even |
| \(3\) | odd |
odd |
This is still a bit slow, but it’s already four times faster than the original, and could be a meditation upon geological changes.
4D Terrains
#spoilerAlert: the fourth dimension is time.
#spoilerAlert2: we probably won’t need to call noise() using \(4\) parameters.
Before we start, let’s get our canvas ready for \(3D\) drawings.
Instead of the pixel group trick above, let’s draw squares of width gridWidth with our colors. This makes our terrain look a little too pixelated, or 8-bit, in our current monitors, but we’ll change it soon:
Now, let’s add the \(3^{rd}\) dimension. We’ll have to change our canvas type to WEBGL:
createCanvas(windowWidth, windowHeight, WEBGL);
And translate the canvas back to the top-left of the screen since in WEBGL mode the \((0, 0)\) origin is in the center of the canvas:
translate(-width / 2, -height / 2);
And, just to make sure we actually have a \(3^{rd}\) dimension, let’s rotate the canvas around its \(x-axis\) with:
rotateX(PI / 3);
In order to add height/depth to our map, we have to change how we draw the squares on screen.
Since we’re going to want to control all \(3\) dimensions of every vertex in our rectangles, instead of drawing flat rectangles we should consider drawing shapes using the p5.js beginShape() function. We could use QUADS, but QUAD_STRIP and TRIANGLE_STRIP will make it even easier for us to specify the vertices of all rectangles in any given row.
To put this into code, we just have to realize that when drawing row y, we actually also need vertices that would be at row y + gridWidth, so we’re always drawing pairs of vertices.
Order of visited locations for drawing rectangles:
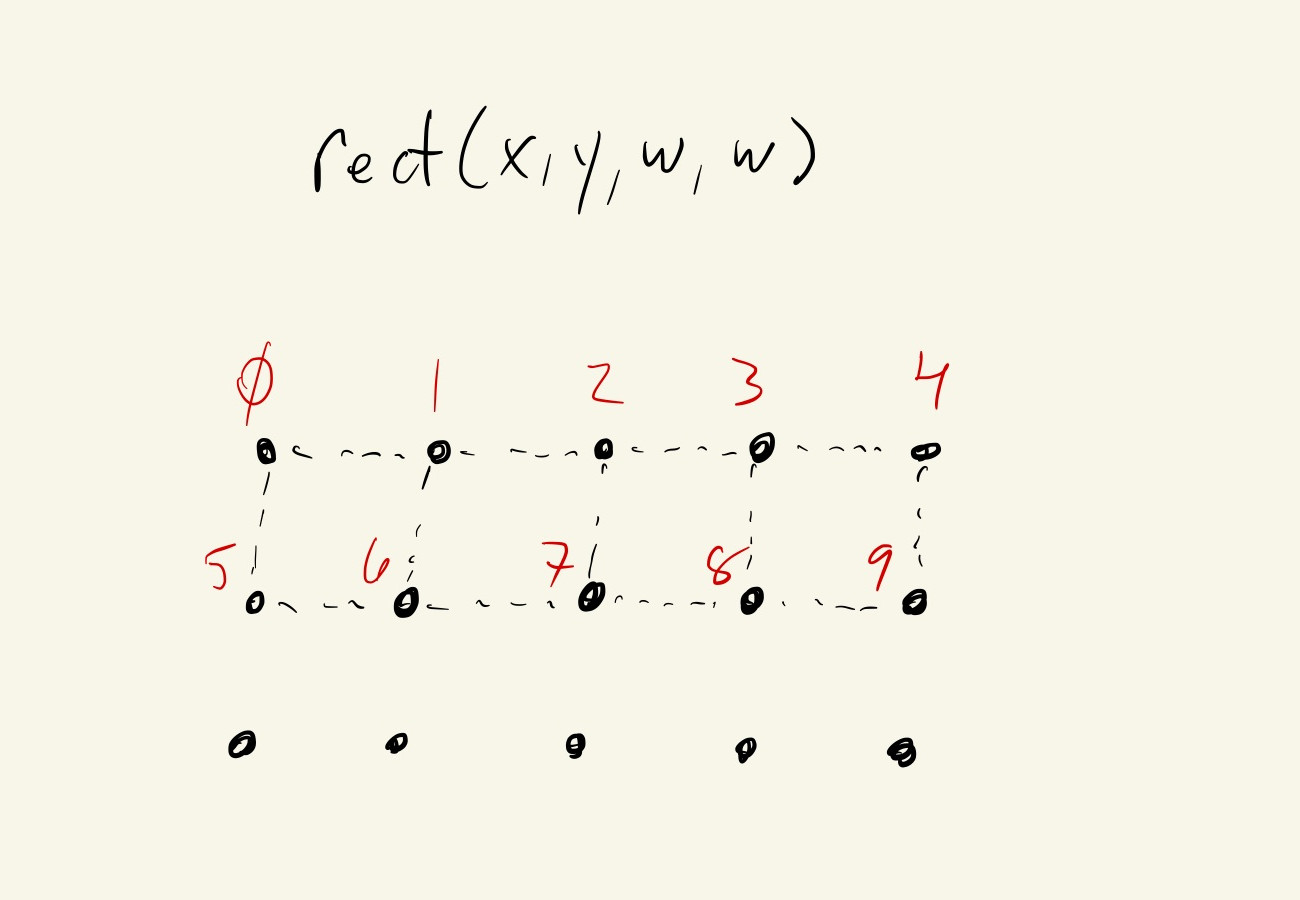
Order of visited vertices for drawing QUAD_STRIPS:
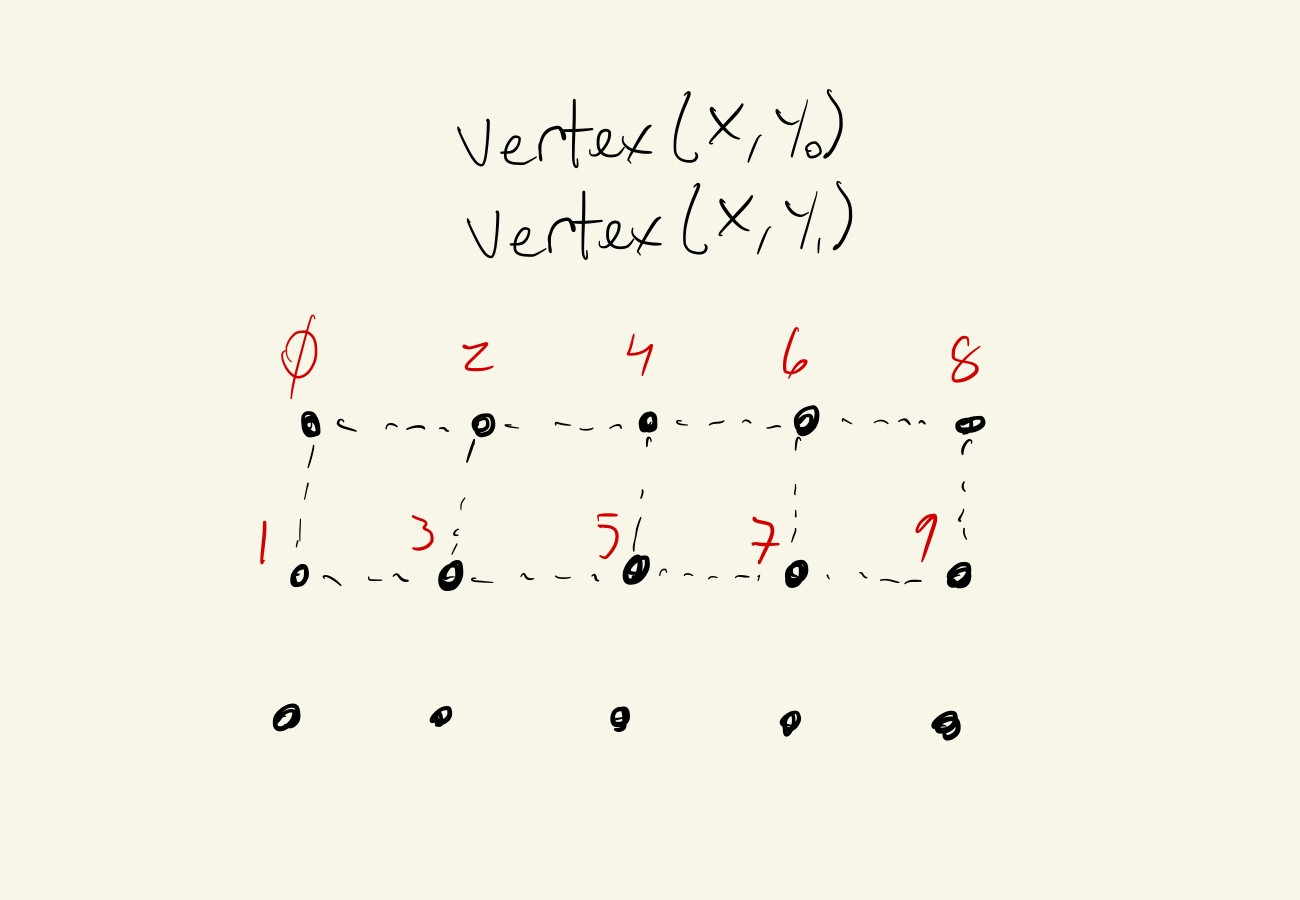
The code:
vertex(x, y, 0);
vertex(x, y + gridWidth, 0);
Drawing rectangles like this speeds up our sketch because instead of sending color and shape information to our screens for every rectangle in our grid, the CPU prepares a whole strip/row of colors and shapes, that only get sent to the monitor once per row.
We can even increase our gridWidth a little:
We just have to add heights to our vertices.
Since we already have a noise number that we’re using to calculates the colors of our map, we can use the same number to pull our vertices up or down in the z direction:
let z = map(nLevel, 0, 1, -128, 128);
And we need to add another call to noise(), using the values for the position of the second vertex in order to get its z value.
In pseudo-code:
let nLevel0 = noise(x, y, t);
let nLevel1 = noise(x, y + gridWidth, t);

let z0 = map(nLevel0, 0, 1, -128, 128);
let z1 = map(nLevel1, 0, 1, -128, 128);

vertex(x, y, z0);
vertex(x, y + gridWidth, z1);
In real code, with some adjustments to the position of the canvas:
This is good. Interesting. It looks like the rise and fall of mountains, but the colors and the blending between colors doesn’t look too good.
This is because the QUAD_STRIP tries to blend colors between its vertices, but since each row is a separate strip, it only blends in the x direction.
We can, of course, just remove all of the colors:
But, this is boring. Let’s fix our colors and in the process learn some tricks for speeding up generative graphics.
Let’s begin by combining all of the QUAD_STRIP shapes into one shape, by calling beginShape() only once, outside all of our loops:
It looks like in addition to NOT fixing the blending, this also broke something else.
When our QUAD_STRIP gets to the end of a row, it gets connected to the vertices at the very beginning of the next row. This is what’s causing the long weird diagonal shapes in our canvas. We can fix this by adding some extra vertices under the canvas to hide these connecting QUADS.
for (let y = 0; y < height; y += gridWidth) {
  vertex(0, y, -200);
  vertex(0, y + gridWidth, -200);
  for (let x = 0; x < width; x += gridWidth) {
    // ... draw vertices
  }
  vertex(width, y, -200);
  vertex(width, y + gridWidth, -200);
}
Independent of this, the reason why the colors aren’t blending between rows is because the two vertices we add every iteration are getting the same color value based on the noiseLevel of the first vertex. So there’s no blending to be done. We should instead give each vertex its own color.
Let’s refactor the color logic into a function and call that twice, once for each of the two noiseLevel values:
This is better !
But, what if we added our own blending between colors at each level?
Since we already separated the color logic into its own function, this shouldn’t be too bad.
For each of the color levels, we’ll use lerpColor() to pick a color value between the previous and current colors. Before calling lerpColor() we just have to map() the noiseLevel from our specific color level range to a value between \(0\) and \(1\):
// at color level 1
let t = map(n, minN, maxN, 0, 1);
fColor = lerpColor(COLOR[0], COLOR[1], t);
This can get a bit slow, due to all of the color blending, but since we now have blending between vertices and blending between height levels, we can decrease the resolution of our grid to try to increase our frame rate:
This looks good!
And now that the colors are fixed we can clearly see that our ocean is not working like an ocean at all. There are no valleys in the middle of the ocean!
Let’s fix that by adding some clamping to our height map. There should be no negative heights, and the positive heights should only start with the third color, so, when noiseLevel is greater than \(0.5\):
let z0 = map(nLevel0, 0.5, 1, 0, 128, true);